
Figure 1.
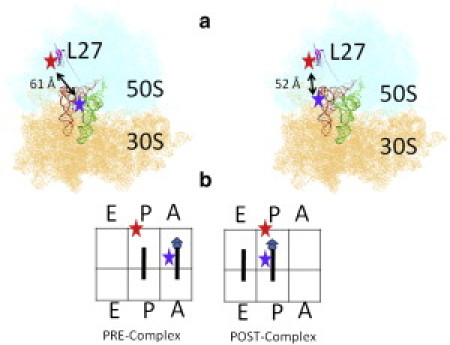
(a) The relative labeling positions of the FRET pairs on the ribosome L27 and the tRNAs at the A-site (left plot) and P-site (right plot). (b) Illustration of the ribosome complexes studied in this work. The triangle represents the N-acetyl-capped phenylalanine, and the circles represent the elongated phenylalanines.