
Figure 5.
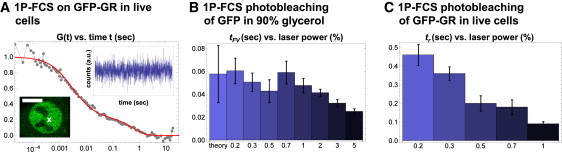
Evidence for cryptic photobleaching in 1P-FCS. (A) 1P-FCS experiments were performed in cells expressing GFP-GR. Photon counts in the 1P excitation volume (white x) fluctuate about a constant mean throughout the measurement (upper inset, data rebinned for illustration purposes), indicating no apparent photobleaching. The temporal autocorrelation G(t) of these data (joined gray points) was averaged with that of analogous data to produce the displayed curve. A fit (smooth solid line) to the same reaction-diffusion model used for FRAP and 2P-FCS yielded D = 3.1 μm2/s, B = 0.23, and tr = 0.63 s. (B) 1P-FCS was performed on unconjugated GFP freely diffusing in PBS mixed with 90% glycerol. Only laser powers that yielded a constant count rate were used (by adjusting the AOTF from 0.2% to 5%), but at higher laser powers τFV was always lower than theory predicted, consistent with cryptic photobleaching. At the lower powers, however, theory and experiment agreed, suggesting that cryptic photobleaching was minimal. (C) 1P-FCS was performed on GFP-GR in live cells. As the laser power increased, the binding residence time tr decreased, again consistent with photobleaching. As with 2P-FCS, a plateau in the estimated binding residence times tr could not be established, due to an insufficient signal/noise ratio at lower laser powers.