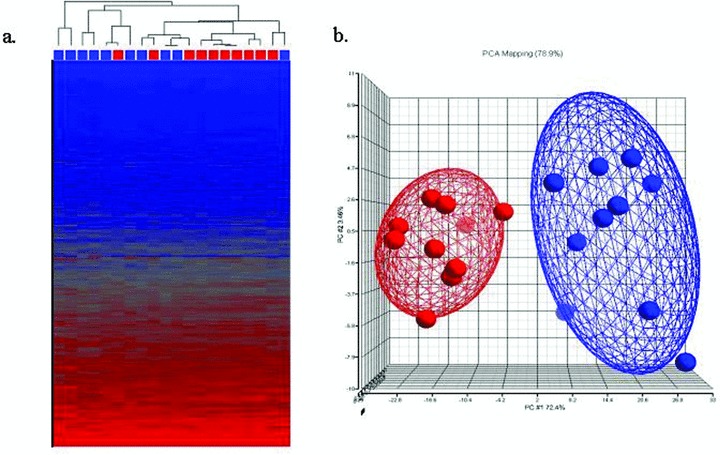
Figure 1.

(A) Unsupervised dendrogram and Heatmap. Unsupervised hierarchical clustering was performed using the 17,412 probesets. The red boxes below the dendrogram indicate SSc without PAH; blue boxes indicate SSc‐PAH. Blue color in the Heat map indicates relatively low transcript expression, red color indicates relatively high transcript expression. (B) Supervised principal component analysis of the Microarray Cohort. SSc without PAH (n= 10, red) and SSc‐PAH (n= 10, blue). At p < 0.0001, 459 genes were differentially expressed between the two groups.
