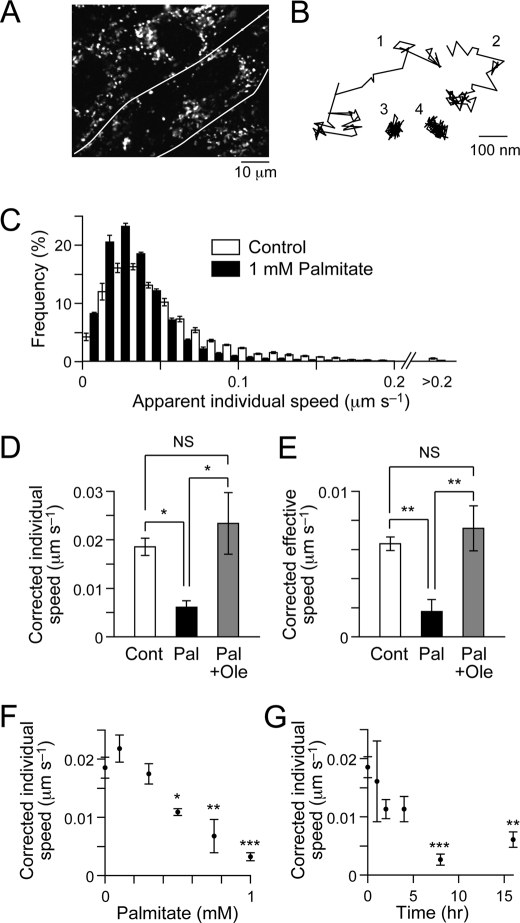
FIGURE 9.
Effects of palmitate and oleate on movement of intracellular acidic compartments. A, fluorescent image of C2C12 myotubes stained with LysoTracker Red. The area between the white lines represents a single myotube. B, typical traces of acidic compartment movement. C, distributions of apparent individual speed of acidic compartment movements when treated without (white) or with (black) 1 mm palmitate for 16 h. D and E, mean individual (D) and effective (E) speeds of acidic compartment movement in control (Cont, white), 1 mm palmitate-treated (Pal, 16 h, black), or 1 mm palmitate + 0.3 mm oleate-treated (Pal + Ole, 16 h, gray) C2C12 myotubes. The apparent speed in fixed cells (individual speed,0.028 μm s−1; effective speed, 0.002 μm s−1) was subtracted from the values of the cells treated as indicated (see “Experimental Procedures”). Statistical analyses were performed with Tukey's multiple comparison test. *, p < 0.05; **, p < 0.01. F and G, dose response (F) and time course (G) of the effects of palmitate on acidic compartment movement. The data were corrected with the apparent movement speed in fixed cells, as in D. Statistical analyses were performed with Dunnett's multiple comparison test versus 0 mm (D) or 0 h (E). *, p < 0.05; **, p < 0.01; ***, p < 0.001. The data were obtained from four to nine cells.

