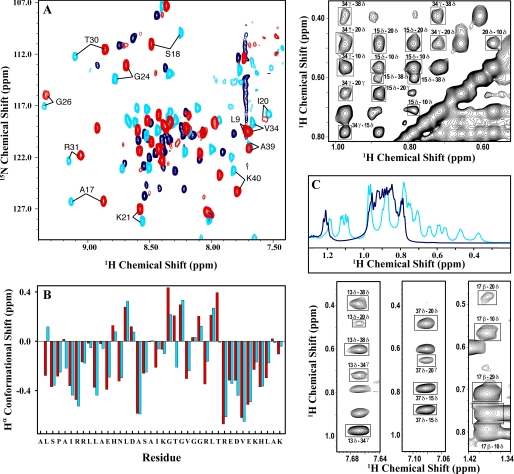
FIGURE 2.
Structural analysis of the salt-refolded state of BBL by NMR. A, H1-N15 SOFAST-HMQC spectra measured at 283 K with 15N natural abundance for native BBL at pH 7 (red), native BBL at pH 3 and 2 m LiCl (light blue), and acid-denatured BBL at pH 3 (dark blue). The labels indicate some cross-peaks that are characteristic of the BBL native state. B, Hα conformational shifts calculated as the difference between the chemical shift of the protein and the typical random coil values for the same residues. Light blue, data at pH 3 plus 2 m LiCl; red, data at pH 7. C, the aliphatic region in the one-dimensional proton NMR spectrum of BBL at pH 3 with 2 m LiCl (light blue) and without (dark blue). The upper and lower panels on the right show fragments of the NOESY spectrum of BBL at 283 K, pH 3, and 2 m LiCl. NOEs between side chain protons of hydrophobic residues indicating critical tertiary contacts in the native structure of BBL are marked in boxes. The residues of BBL involved in these contacts are as follows: Leu10, His13, Leu15, Ala17, Ile20, Leu29, Val34, His37, and Leu38.

