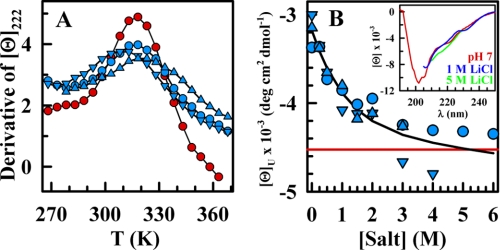
FIGURE 3.
Comparing the thermal unfolding of salt-stabilized BBL at pH 3 and native BBL at pH 7. A, first derivative of the CD thermal unfolding curves of BBL at pH 7 (red circles) compared with those at pH 3 and 2 m of LiCl (blue circles), NaCl (blue triangles), and CsCl (blue inverted triangles). Black curves connect the data points to guide the eye. B, CD signal at 222 nm of the BBL high temperature (368 K) denatured state at pH 3 and 2 m LiCl, NaCl, and CsCl. Symbols are as described in A. The red line corresponds to the CD signal at pH 7 and the same temperature. The black line is a fit to an exponential function to guide the eye. Inset, far-UV CD spectra of BBL at 363 K and pH 7 (red), pH 3 plus 1 m LiCl (blue), or pH 3 plus 5 m LiCl (green).

