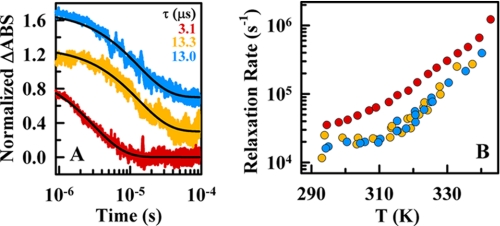
FIGURE 5.
Ultrafast relaxation kinetics of BBL measured by the nanosecond IR temperature-jump method. A, normalized time-dependent changes in the amide I band absorbance at 1632 cm−1 (ΔABS) after temperature-jumps of ∼10 K to a final temperature of 325 K. Red, decay at pH 7 without salt; orange, decay at pH 7 plus 4 m LiCl; blue, decay at pH 3 plus 4 m LiCl. The black lines show the fits to a single exponential function. B, relaxation rates as a function of temperature for the three experimental conditions of A (color scheme as described in A). The data points shown at pH 7 (red) are the average of three measurements, whereas both data sets at 4 m LiCl correspond to single measurements.

