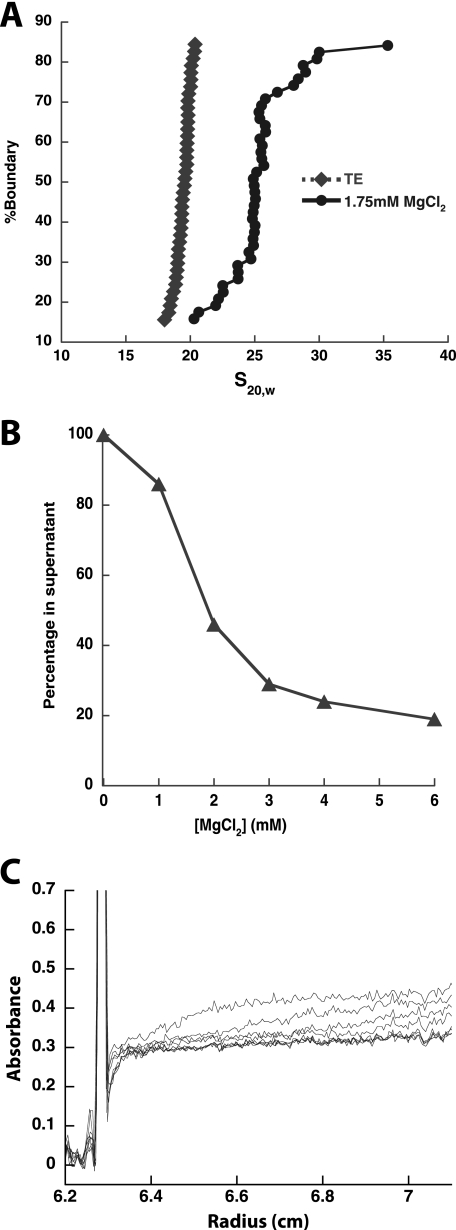
FIGURE 2.
Tetranucleosomal array containing wild type octamers show intra- and internucleosomal compaction. A, intra-array compaction of tetranucleosomal arrays is shown. A representative integrated sedimentation coefficient distribution plot of tetranucleosomal arrays with wild type octamers in the presence (1.75 mm MgCl2) and absence (TE) of divalent magnesium ion. s20,w is the sedimentation coefficient corrected for water at 20 °C. B, inter-array association of tetranucleosomal arrays is shown. A representative self-association plot of tetranucleosomal arrays with wild type octamers is shown. The fraction of tetranucleosomal array remaining in the supernatant is plotted as a function of MgCl2 concentration. C, sedimentation velocity analysis of self-associated tetranucleosomal array species generated at 1.75 mm MgCl2 is shown. Shown are 10 boundary plots generated at 3000 rpm from 0.8 to 12.5 min. Of the species that are not already sedimented by the first scan, those with large sedimentation coefficients are observed between 0.3 and 0.4 absorbance units, whereas those with relatively small sedimentation coefficients are observed below 0.3 absorbance units.

