FIGURE 1.
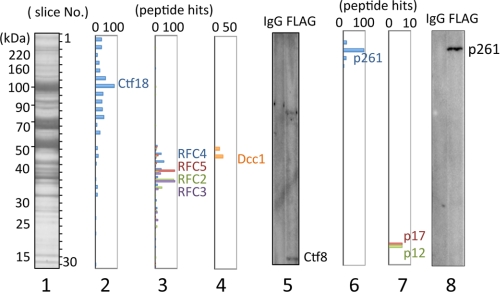
Analyses of Ctf18-interacting proteins from lysates of 293 cells expressing FLAG-Ctf18. Proteins co-eluted with FLAG-Ctf18 from an anti-FLAG column were separated in a 7.5–17.5% SDS-acrylamide gel followed by Coomassie Brilliant Blue staining (lane 1). The gel was sliced into 30 pieces (numbered from top to bottom as indicated in lane 1), and included proteins were identified by LC/MS/MS analysis. Panels 2, 3, 4, 6, and 7 indicate hit numbers of detected peptides for Ctf18, RFC2–5, Dcc1, pol ϵ p261, and p17/p12, respectively. Comparable immunoblotting of Ctf8 (panel 5) and p261 (panel 8) with eluates from control IgG-Sepharose (IgG) and from the anti-FLAG column (FLAG) are shown in each panel. In addition to the Ctf8-specific band, a background band appears in lane 5 in the high molecular mass area.

