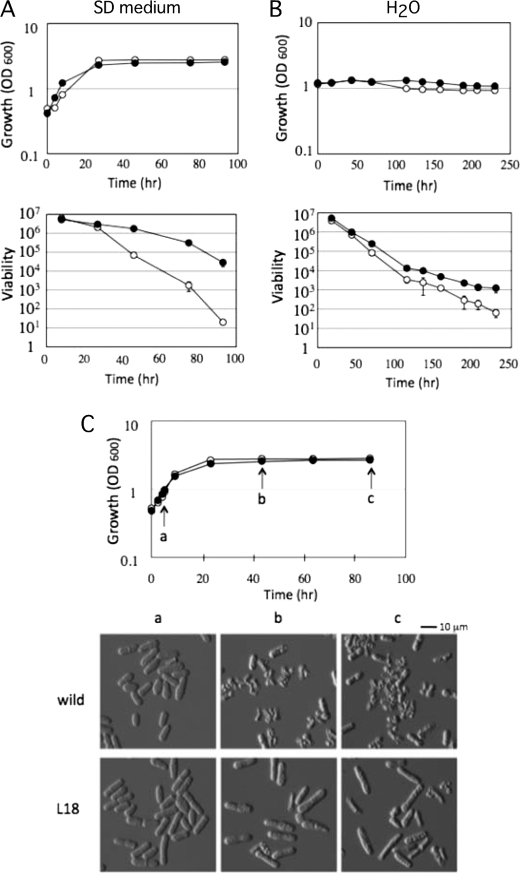
FIGURE 1.
Phenotypes of the mutant that increases cell viability after entry into stationary phase. A and B, cell growth (upper panels) and cell viability (lower panels) of wild-type (○) and L18 mutant (●) cells in SD medium (A) and in H2O (B) were monitored. The data shown represent the mean ± S.D. of three independent experiments. C, cell morphology at various growth phases. Wild-type (○) and L18 mutant (●) cells were sampled at each time point indicated (arrows a–c) in the growth curve and subjected to microscopic observation.

