FIGURE 3.
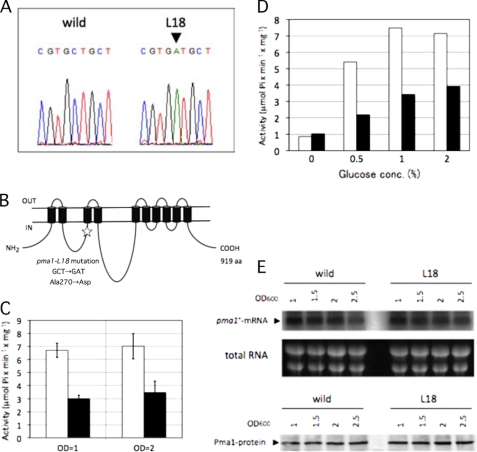
L18 has a mutational lesion in the pma1+ gene that causes a decrease in Pma1 ATPase activity. A, the pma1 gene of the L18 mutant was sequenced, and an identified mutation (C-to-A substitution) is shown (arrowhead). B, schematic representation of the topology of the Pma1 protein in the plasma membrane. The mutation site (A270D) is indicated (star). aa, amino acids. C, Pma1 activities in wild-type (open bars) and L18 mutant (closed bars) cells were assayed using a cell lysate prepared from cells grown in SD medium to A600 = 1 or 2. The data shown represent the mean ± S.D. of three independent experiments. D, Pma1 activities in wild-type (open bars) and L18 mutant (closed bars) cells were assayed using a cell lysate prepared from cells grown in SD medium containing the indicated concentrations of glucose. E, expression profile of Pma1 with growth. Wild-type and L18 mutant cells were grown in SD medium at 30 °C. Total RNAs were isolated from cells at each absorbance (OD) indicated and subjected to Northern blot analysis with a radiolabeled pma1+ probe (upper panel). An ethidium bromide-stained gel showing total RNA is presented as a loading control (middle panel). Wild-type and L18 mutant cells were grown as described above, and a cell lysate was prepared. The amount of Pma1 protein was analyzed by Western blotting using Pma1 antiserum (lower panel).

