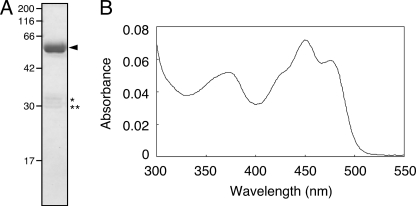
FIGURE 3.
Purification and absorption spectrum of SlLLP. A, SDS-PAGE was carried out using a 12% polyacrylamide gel. The gel was stained with Coomassie Brilliant Blue R250. The arrowhead indicates the position of SlLLP. The molecular sizes (in kDa) are indicated on the left side. The asterisks indicate degradation products of SlLLP. B, absorption spectrum of SlLLP.

