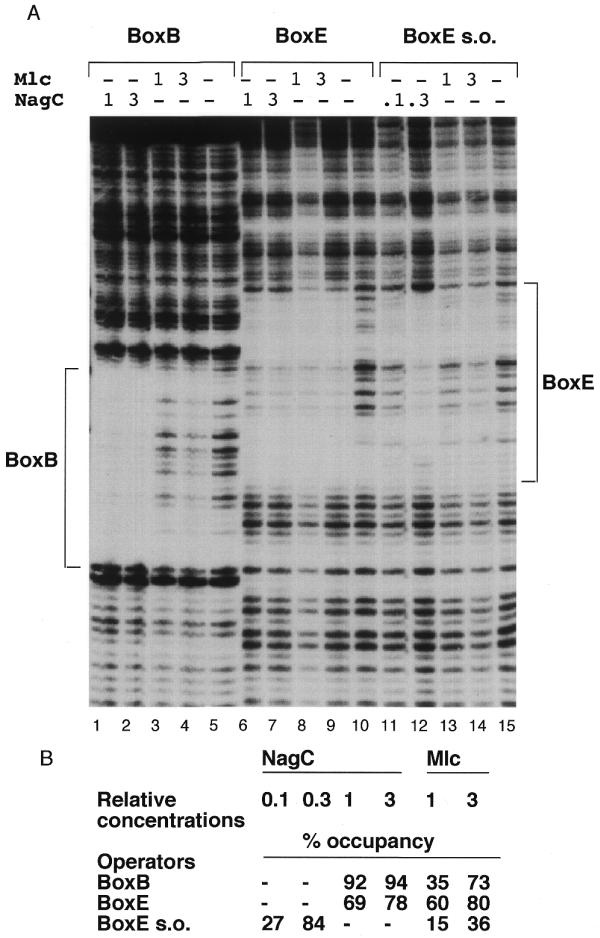
Figure 4.

Footprint of NagC and Mlc binding to the single nagB and nagE operators. (A) Labelled DNA fragments (~6 nM) with BoxB, Nag15B*–HphI (lanes 1–5), BoxE, Nag14E*–XbaI (lanes 6–10) and BoxE s.o. Nag14E*–Nag42B with the –11C,+11G mutation (lanes 11–15) were mixed with different amounts of NagC or Mlc extracts. The locations of the protected nagE and nagB operators (BoxE and BoxB) are indicated. The relative concentrations of Mlc and NagC are shown at the top of each lane. ‘1’ corresponds to ~33 µg/ml total extract protein of which Mlc or NagC represents a few percent. (B) The relative protection of each operator by Mlc or NagC was calculated as described in Materials and Methods and is reported as percentage occupancy data for each site by the different amounts of the proteins tested. A dash indicates that that concentration was not tested on the operator indicated. (Note, since the absolute amounts of NagC or Mlc in the extracts are unknown it is only possible to compare the relative binding of the same extract with the different operators and not the binding of NagC and Mlc with the same operator.)
