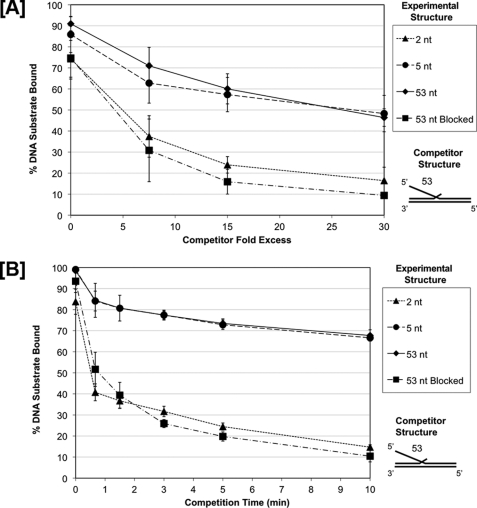
FIGURE 5.
FEN1 shows slow dissociation from long unblocked 5′ flaps and fast dissociation from short or blocked 5′ flaps in the presence of a competitor substrate. FEN1 dissociation was measured by EMSA as described under the “Experimental Procedures.” Reactions were initiated by incubating FEN1 with various 5′ flap experimental substrate configurations, a 2 nt flap (U1:T1:D1.2), a 5 nt flap (U1:T1:D1.5), a 53 nt flap (U1:T1:D1.53), and a 53 nt streptavidin pre-blocked flap (U1:T1:D1.53B) for 10 min followed by the addition of a 53 nt flap competitor substrate (U1:T1:D1.53). In A, increasing concentrations of competitor substrate were added (7.5×, 15×, and 30× molar excess relative to experimental substrate) to the reaction for 10 min. In B, 30× molar excess competitor substrate was added to the reaction for increasing amounts of time (0.75, 1.5, 3, 5, and 10 min). A and B show the graphical quantitation of the percent experimental substrate remaining bound by FEN1 after competition based on at least three independent EMSA results. The legend indicates the experimental substrate 5′ flap configuration. The competitor substrate configuration is shown to the right of the figure.

