FIGURE 6.
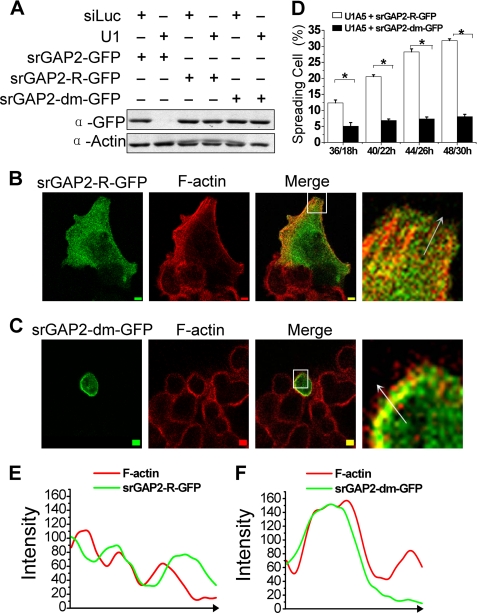
The functional analysis of srGAP2 arginine methylation. A, HCT116 cells cotransfected with shRNA and GFP-tagged srGAP2 as indicated, and whole cell extracts were probed with antibodies against GFP or actin (loading control). As shown, srGAP2-R-GFP and srGAP2-dm-GFP were resistant to U1 (srGAP2 shRNA). B and C, U1A5 transfected with srGAP2-R-GFP (B) or srGAP2-dm-GFP (C) were stained with TRITC 545-phalloidin to visualize F-actin distribution 22 h after transfection. The right figures are the high-magnification from the left selected inset, showing the distribution srGAP2 and F-actin at the cell membrane protrusion. Bars, 5 μm. D, cell spreading situation of either srGAP2-depleted HCT116 cells (U1A5) transfected with srGAP2-R-GFP or srGAP2-dm-GFP at each indicated time point (n1/n2: n1 means the length of time after plating the cells, and n2 means the length of time after transfection) was counted using the cell spreading assay; see “Experimental Procedures” for details. Data are mean ± S.E. (n = 3; *, p < 0.05, Student's t test). E and F, graphs correspond to intensities in arbitrary units of the green and red labels for each pixel of the arrow drawn through the axis. Graph E is from the arrow in B, and graph F is from the arrow in C.

