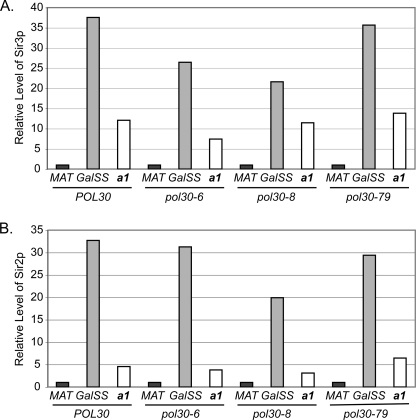
FIGURE 2.
Sir protein association at HMR in POL30 and pol30 cells. Sir3 (A) and Sir2 (B) protein association at MAT (negative control locus), the synthetic silencer GalSS, and a1 at HMR was monitored in the indicated strains by chromatin immunoprecipitation using anti-Sir3p or anti-Sir2p antibodies. Co-precipitating DNA was examined by quantitative real-time PCR (see “Experimental Procedures”). The efficiency of co-precipitation of each locus in each strain was normalized and expressed relative to MAT, with MAT = 1; 2[(Sir CT − IgG CT)MAT − (Sir CT − IgG CT)locus]. An average of n = 2 is shown. Data for individual replicates are provided in supplemental Tables 3 and 4.

