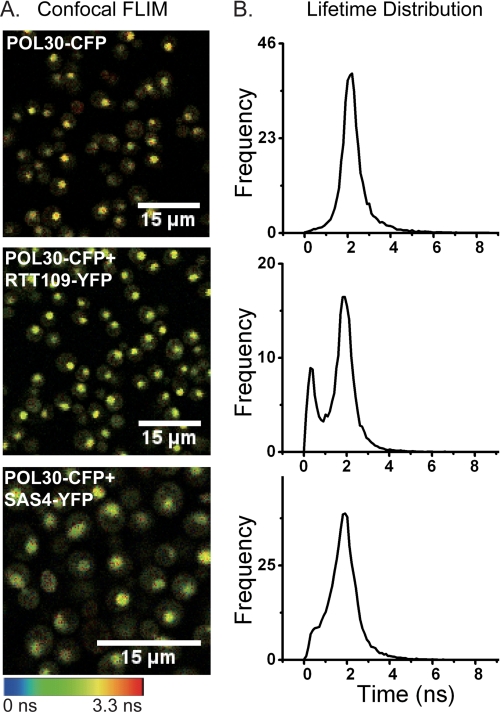
FIGURE 3.
PCNA interacts with Rtt109p and SAS-I in vivo. Shown are confocal fluorescence lifetime images of CFP (A) and fluorescence lifetime distributions (B) in single living yeast cells expressing Pol30-CFPp (top), Pol30-CFPp plus Rtt109-YFPp (middle), and Pol30-CFPp plus Sas4-YFPp (bottom). Scale bar: 15 μm.

