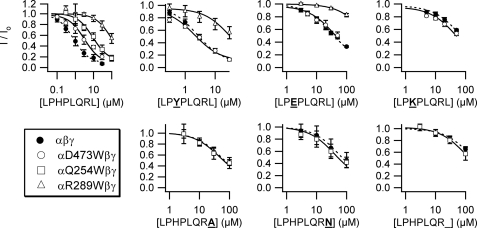
FIGURE 5.
Pairwise interactions between P8 and α ENaC residues. Dose-response curves of various peptides with wild-type and mutant ENaCs as indicated (n = 5–8). Values are mean ± S.D. Data were fit to the Hill equation. Fitted curves for wild-type (dashed line) and mutant (solid line) channels are shown. IC50 values are in Table 2. Where inhibition was <70% at the maximally tested [peptide], maximum inhibition was fixed to 90% for curve fitting.

