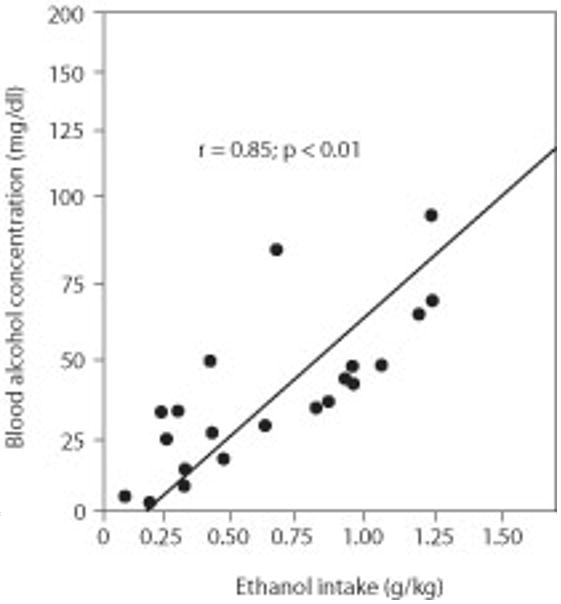
Figure 9.12.2.

Relationship between ethanol intake and blood alcohol levels. Tail blood samples were taken from alcohol preferring (P) rats (n = 22) after having lever pressed for a concurrent presentation of 10% ethanol and 0.025% saccharin following the first 30 min of a 1-hr operant session.
