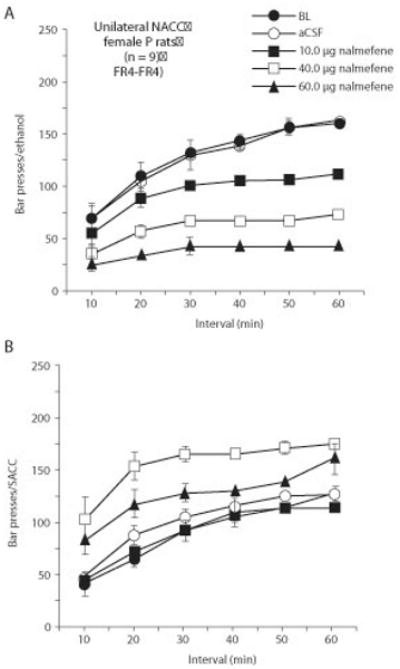
Figure 9.12.6.

Cumulative response profiles in the NACC rats (n = 9) for (A) ethanol- and (B) saccharin-maintained responding for the nalmefene treatment conditions (e.g., 10 to 60 ug) when compared with the control conditions (e.g., aCSF, BL). The data are redrawn from Figure 9.12.3. Asterisks are omitted from the cumulative time course figures for clarity.
