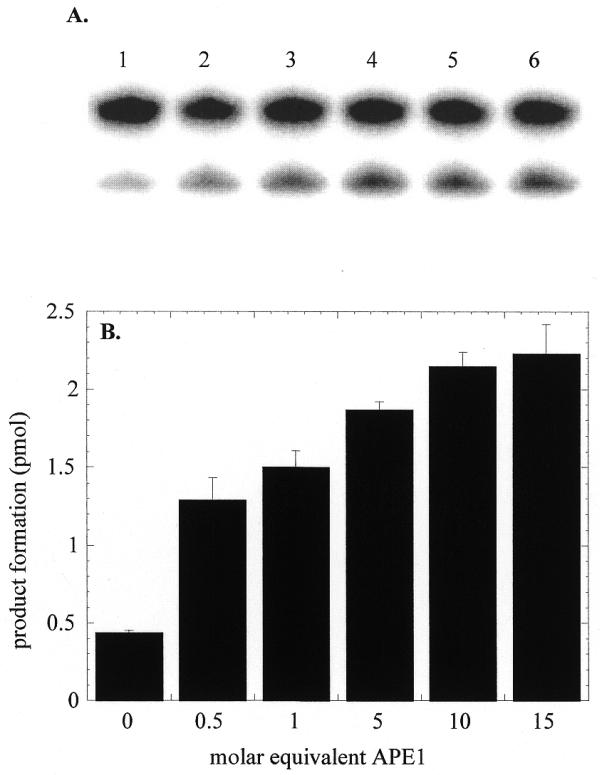
Figure 3.

Stimulation of OGG1 glycosylase activity by APE1. OGG1 (25 nM) was incubated with the 8-oxoG·C oligo (500 nM) in the presence of varying amounts of APE1 (12.5–375 nM) and 1 mM MgCl2 for 5 min at 37°C. Termination of reactions and product analysis were performed as in Figure 1. Reaction 1, OGG1 only; reactions 2–6, OGG1 plus 12.5, 25, 125, 250 and 375 nM APE1. The actual data shown in (A) are presented as a bar graph in (B).
