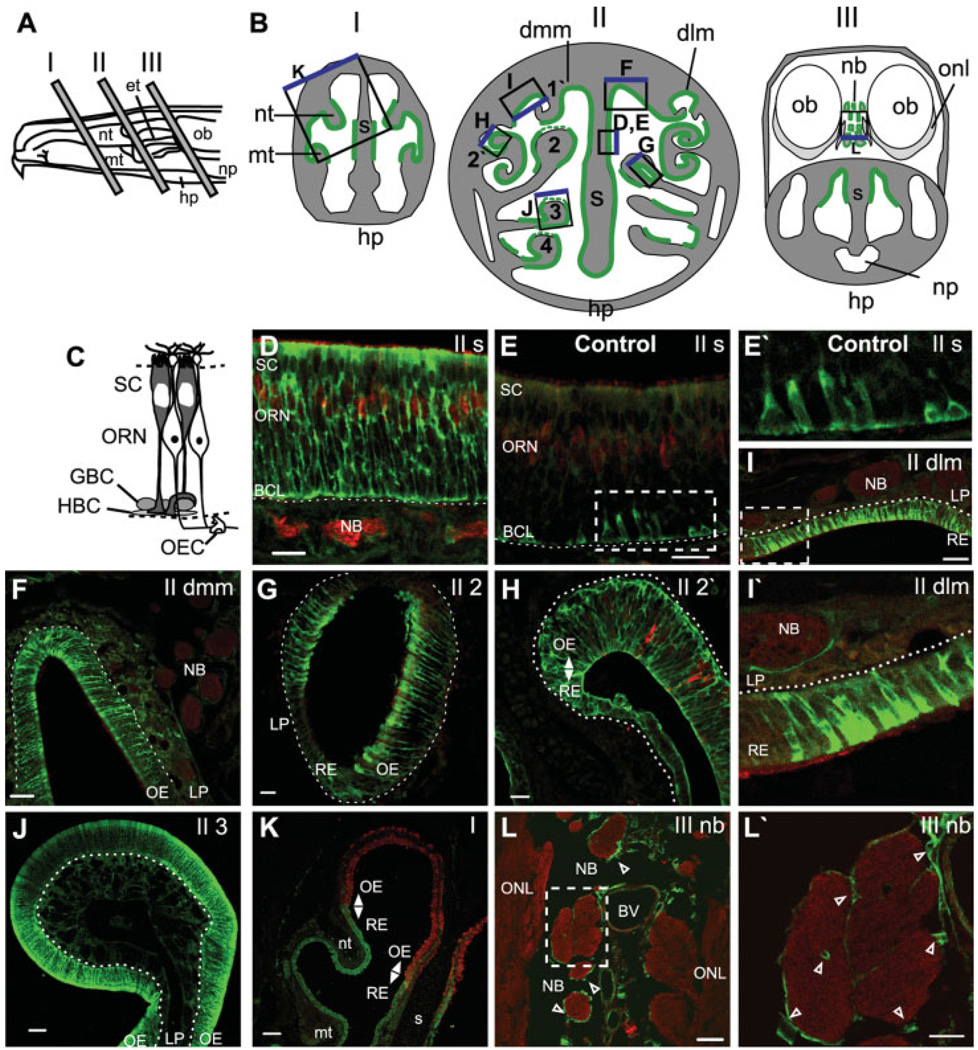
Fig. 1.
In vivo odorant exposure evokes HSP25 expression in neonatal mouse olfactory epithelium. A: Exposed lateral wall of the rodent nasal airway showing locations of tissue selected for analysis. B: Schematics of the anterior face of tissue blocks depicted in A. Regions of odorant-induced HSP25 IR are shown in green, with regions of weak IR depicted by dashed green lines. The boxes indicate regions shown in D–L, and the blue edge orients to the top of each image. The two sides in BII depict tissue blocks from slightly different levels. Drawings are not to scale. C: Schematic of the olfactory epithelium. D–L′: Neonatal Swiss Webster mice were exposed to no odorant (control, E,E′) or r-carvone (D,F–L′) as described in Methods. All tissue was labeled with anti-HSP25 (green), and D–I,K,L were also labeled with anti-olfactory marker protein (OMP; red). E′,I′,L′, enlargements of the boxes in E,I,L. Dashed white lines indicate basement membrane. Open arrowheads indicate OECs. Nt, nasoturbinate; mt, maxilloturbinate; et, ethmoids; hp, hard palate; np, nasopharynx; ob, olfactory bulb; S, septum; dlm, dorsal lateral meatus; dmm, dorsal medial meatus; 1′-2′, first–second ectoturbinates; 2–4, second–fourth endoturbinates; onl, olfactory nerve layer; t, turbinate, nb, nerve bundle; SC, sustentacular cell layer; ORN, olfactory receptor neuron layer; HBC, horizontal basal cell; GBC, globose basal cell; OEC, olfactory ensheathing cell; OE, olfactory epithelium; RE, respiratory epithelium; BCL, basal cell layer; LP, lamina propria. Scale bars = 100 µm in K; 50 µm in F,J; 20 µm in D,E,G–I,L,L′).

