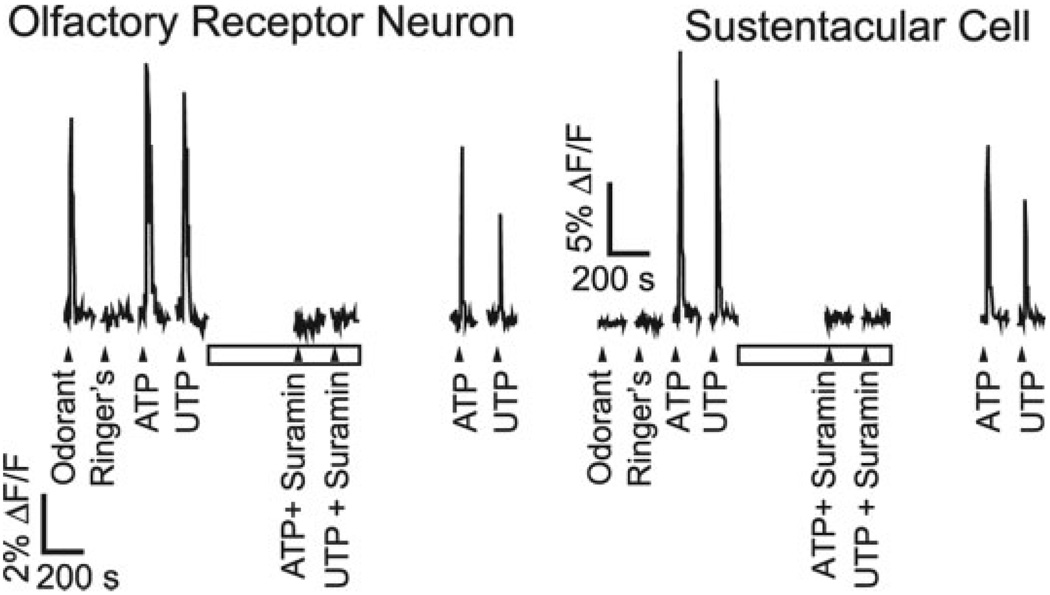
Fig. 3.
Effects of P2R agonists and antagonists on [Ca2+]i levels. Fluorescence increases measured from an individual ORN and a sustentacular cell in a fluo-4 AM loaded mouse OE slice. r-Carvone (10 µM; odorant), Ringer’s solution, and P2R agonists ATP and UTP (10 µM) were superfused onto the slice at times indicated by triangles. Slices were exposed to suramin (100 µM, open bar), a P2R antagonist, 5 min before purinergic agonist superfusion.

