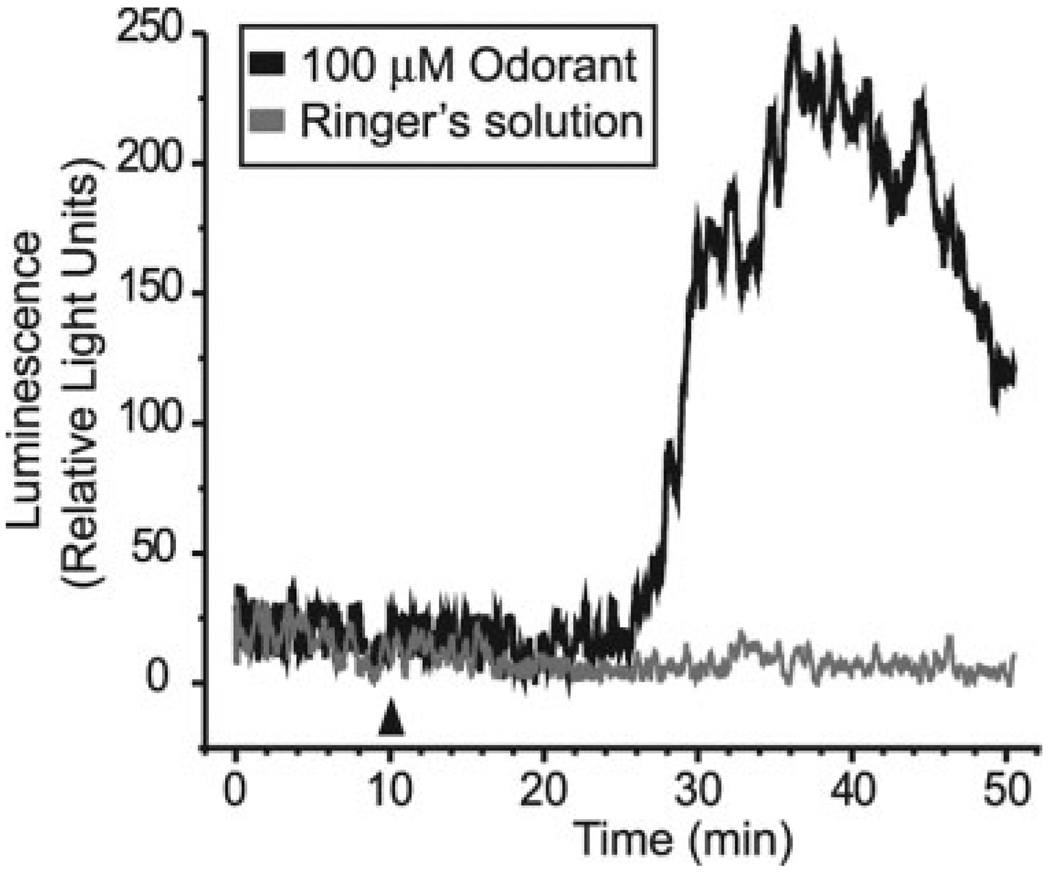
Fig. 4.
ATP is released from OE slices after odorant exposure. Raw ATP bioluminescence data from two separate experiments performed on the same day. Odorant (100 µM final concentration; black line) or Ringer’s solution (gray line) was applied after 10 min (arrowhead) of recording steady state basal ATP release.

