Figure 3.

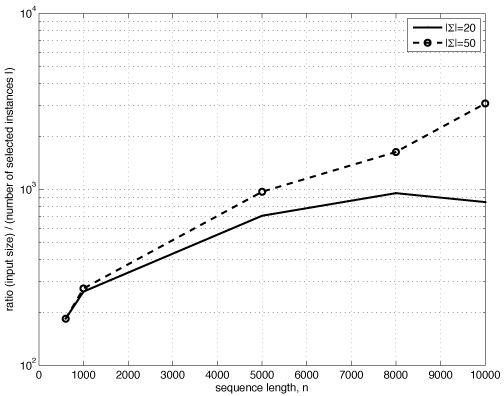
Ratio between input size (nN) and the number of selected samples (I = |I|) as a function of the input length and alphabet size (planted motif problem, k = 13, m = 4). Note logarithmic scale.

Ratio between input size (nN) and the number of selected samples (I = |I|) as a function of the input length and alphabet size (planted motif problem, k = 13, m = 4). Note logarithmic scale.