Figure 2.

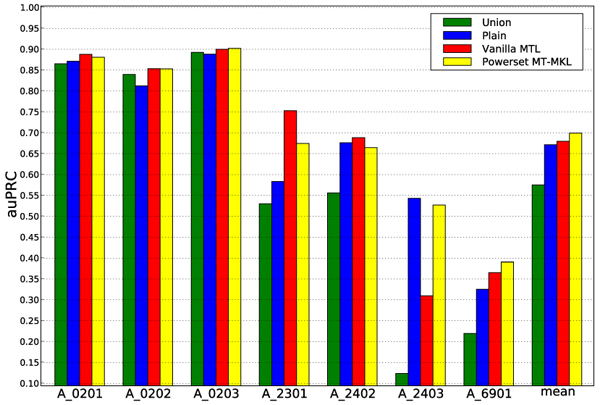
Result for the MHC experiments. Performance is shown for each of the 7 tasks. The performance averaged over all organisms is shown in the rightmost column mean.

Result for the MHC experiments. Performance is shown for each of the 7 tasks. The performance averaged over all organisms is shown in the rightmost column mean.