
Figure 1.
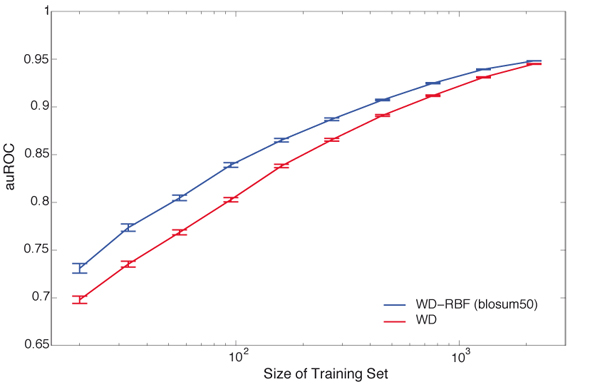
Learning Curve Analysis on MHC allele A*0201. Shown are areas under the ROC curves averaged over 100 different test splits (30%) and for increasing numbers of training examples (up to 70%). The training part was used for training and model selection using 5-fold cross-validation.