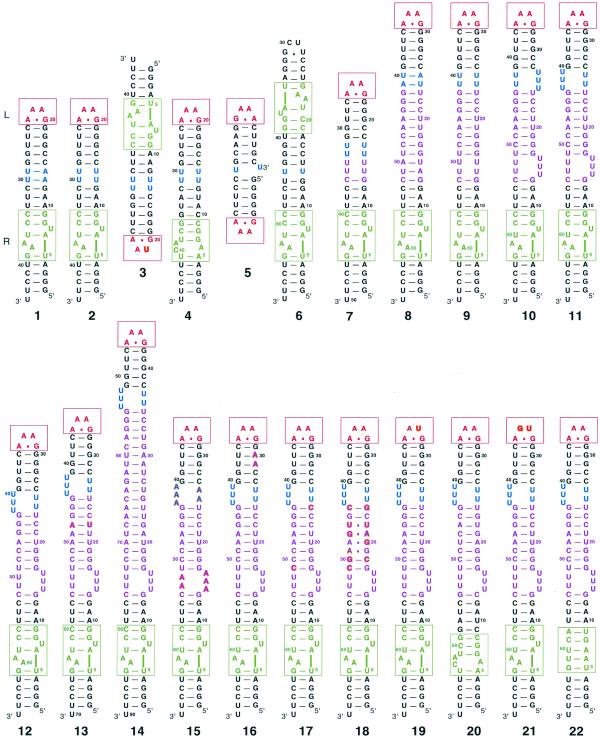
Figure 2.
Secondary structures of all molecules reported (see Table 1). All molecules in the second row are derived from molecule 11. The bases that differ from molecule 11 are shown in bold. A red box is drawn around the tetraloop and a green box around the tetraloop receptor. The color code is the same as Figure 1. Molecules 3 and 4 as well as 5 and 6 are drawn to show their mode of interaction. All molecules were synthesized as described in the Materials and Methods.

