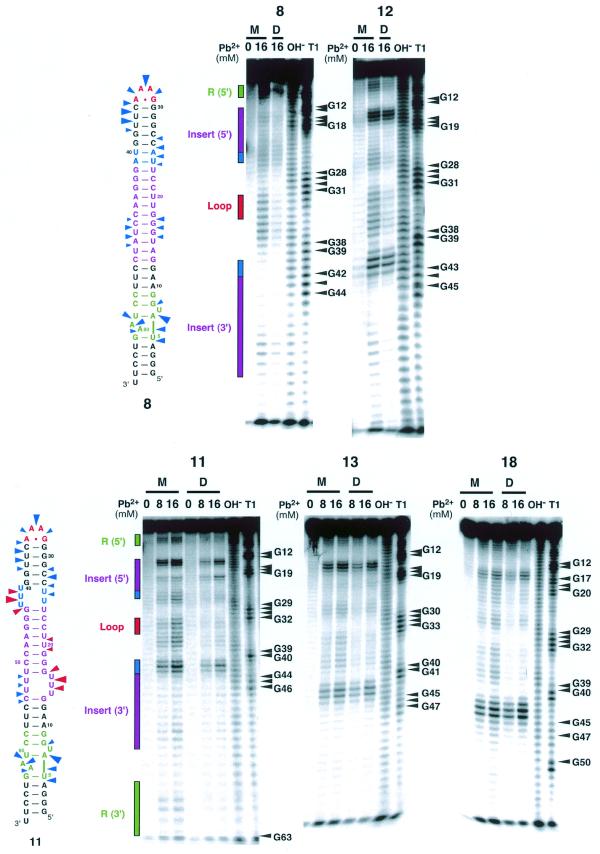
Figure 5.
Lead(II)-induced cleavage patterns for molecules 8, 11, 12, 13 and 18 in their monomeric and dimeric states. Monomer lanes are indicated by M and dimer lanes by D. To maintain the RNA in the monomer state, RNA concentrations were set to 1 nM. To achieve dimerization, the RNA concentration was adjusted to 5 µM for molecules 8 and 12, and 1 µM for 11, 13 and 18, well above the Kd in all cases. Lanes labeled OH– and T1 correspond to alkaline treatment and digestion with RNase T1, respectively. Lead(II)-induced cleavage was performed as described in the Materials and Methods. Phosphates that are cleaved in the monomeric RNA but are mostly protected in the dimeric RNA are indicated with blue arrows on the secondary structures for 8 and 11. Sites that are cleaved in both monomeric and dimeric forms are shown with red arrows. The size of the arrows is roughly proportional to the extent of cleavage in the monomer.

