Table 2. Screening of Meldrum's Acid Derivativesa.
 | |||||
|---|---|---|---|---|---|
| entry | proton donor | time (h) | conversion (%)b | ee (%)c | |
| 1 | 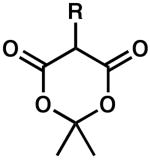 |
R = H | 0.5 | 100 | 90 |
| 2 | R = Me | 0.2 | 100 | 90 | |
| 3 | R = Ph | 24 | 86 | 68 | |
| 4 | R = Allyl | 1 | 100 | 67 | |
| 5 | R = Ac | 24 | 1 | 51 | |
| 6 | 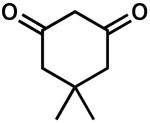 |
24 | 8 | 43 | |
| 7 | 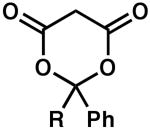 |
R = H | 5 | 100 | 85 |
| 8 | R = Me | 4 | 100 | 84 | |
| 9 | 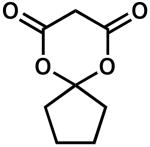 |
24 | 25 | 93 | |
| 10 | 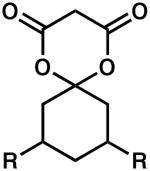 |
R = H | 24 | 86 | 91 |
| 11 | R = Me | 24 | 100 | 76 | |
| 12 | 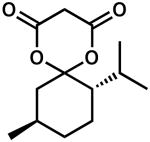 |
24 | 100 | 90 | |
| 13d | 24 | 100 | −90 | ||
Reactions performed with 0.1 mmol of (±)-2 at 0.033 M in p-dioxane.
Measured by 1H NMR spectroscopy.
Measured by chiral HLPC.
Reaction performed with (R)-t-Bu-PHOX (12.5 mol%).
