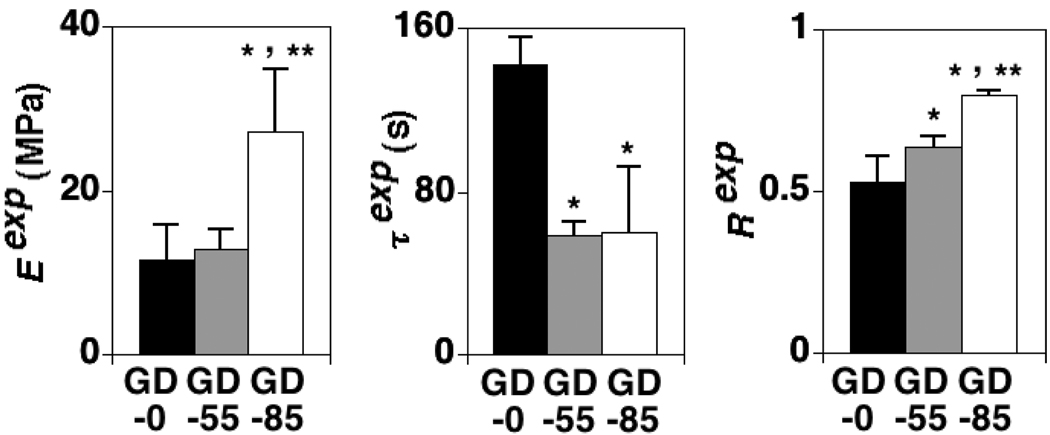
Figure 3.
The effects of GAG depletion treatment on experimental tissue VE parameters (Eexp, τexp, Rexp); mean + 1 standard deviation values shown. GD-0 = control group with no GAG depletion. GD-55 and GD-85 = experimental groups with ~ 55 and 85% GAG depletion, respectively. *=significant difference between experimental and control group values and **=significant difference between experimental group values (ANOVA with post-hoc Tukey testing, p<0.05).

