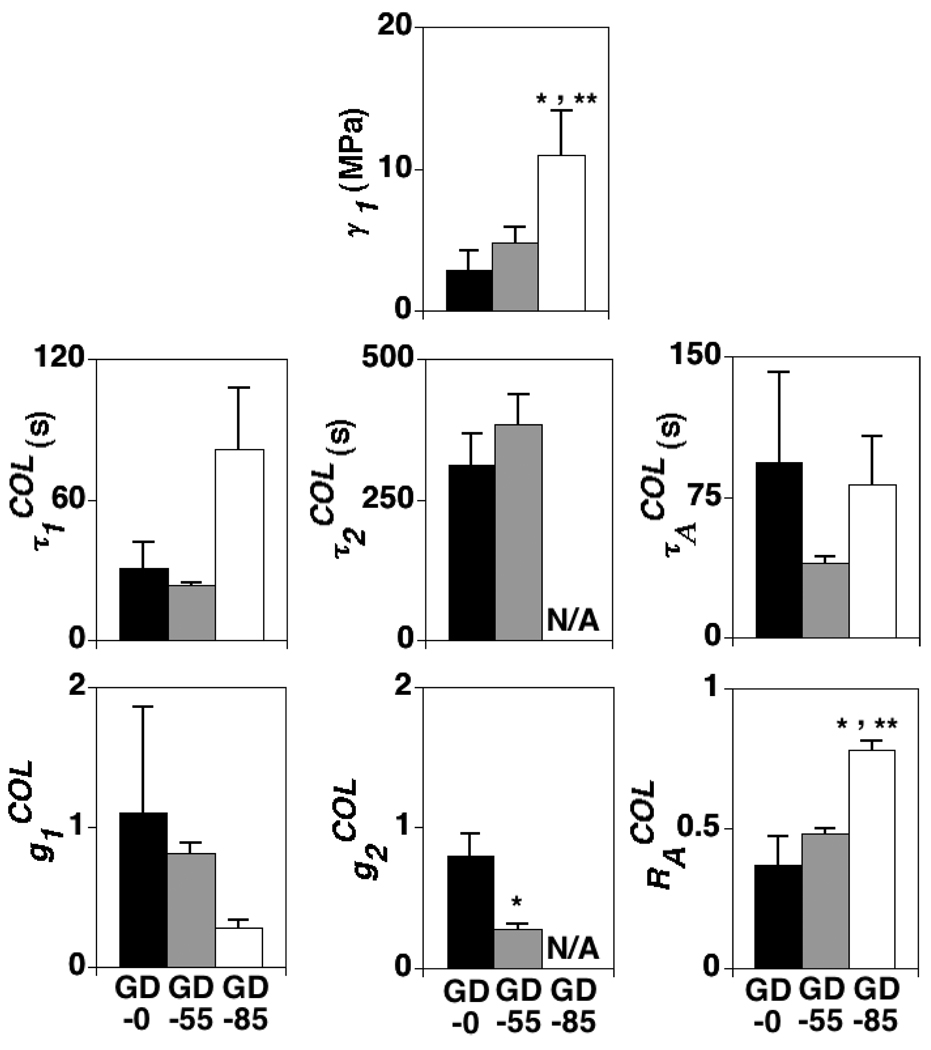
Figure 6.
The effects of GAG depletion treatment on COL VE parameters ; mean + 1 standard deviation values shown. GD-0 = control group with no GAG depletion. GD-55 and GD-85 = experimental groups with ~ 55 and 85% GAG depletion, respectively. values not reported for GD-85 specimens because only one Prony series term was used in the COL relaxation function for that group. For : *=significant difference between experimental and control group values and **=significant difference between experimental group values (ANOVA with post-hoc Tukey testing, p<0.05). For : *=significant difference between GD-0 and GD-55 group values (paired t-test, p<0.05).

