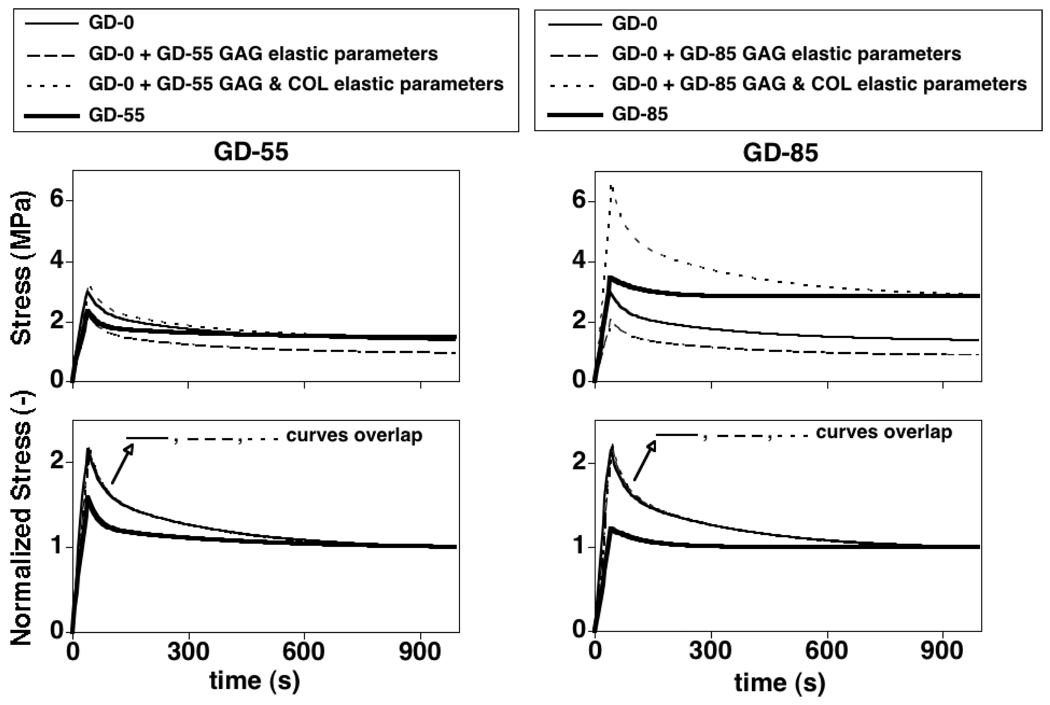
Figure 8.
Parameter study results to differentiate between the different mechanisms arising from GAG-COL interactions on the experimental tissue VE response. Absolute (top) and normalized (bottom) stress results for UT simulations with progressive changes in untreated (GD-0) group parameters due to treatment (GD-55, GD-85); parameters used are listed in Table 1. The stress-time curves from the first 3 simulations for each treatment were indistinguishable in the normalized stress plots. GAG and COL elastic parameters modulate peak and equilibrium stresses (top) but not relaxation behavior (bottom). COL viscous parameters modulate peak and equilibrium stresses (top) and relaxation behavior (bottom).

