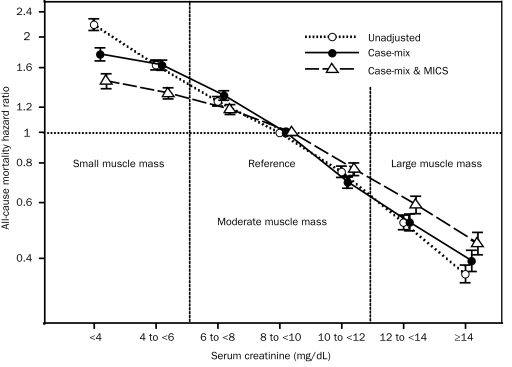
FIGURE 3.
Time-dependent associations between 3-month–averaged serum creatinine concentrations before hemodialysis, as a surrogate of muscle mass, and 5-year (July 1, 2001, through June 30, 2006) mortality in 107,082 patients receiving hemodialysis. Cox regression–based hazard ratios of death are represented by unfilled circles for the unadjusted model, filled circles for the model adjusted for case mix, and unfilled triangles for models adjusted for case mix and the malnutrition-inflammation-cachexia syndrome (MICS). Error bars represent 95% confidence intervals. See legend of Figure 1 for the list of covariates in multivariate adjustment.

