
Fig. 1.
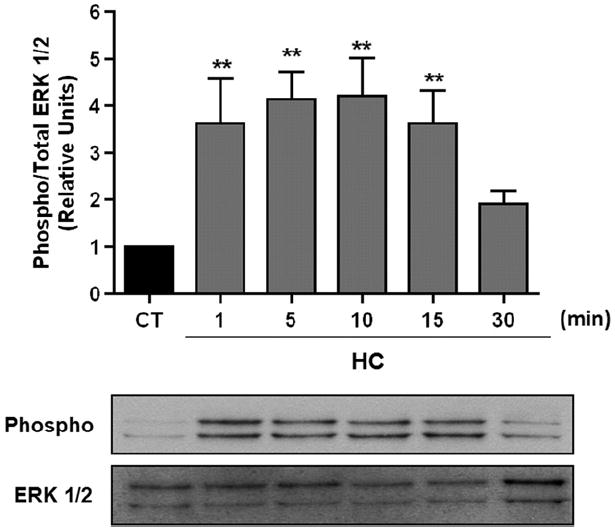
ERK 1/2 is activated in a time-dependent manner in AEC exposed to high pCO2. ATII cells were exposed to 40 (black bars) or 120 (grey bars) mmHg pCO2 for 1–30 min. Phospho-ERK 1/2 and total amount of ERK 1/2 were measured by Western blot analysis. Graph represents the phospho/total ERK 1/2 ratio. Values are expressed as mean ± S.E.M., n = 4. Representative Western blots are shown. **P < 0.01.