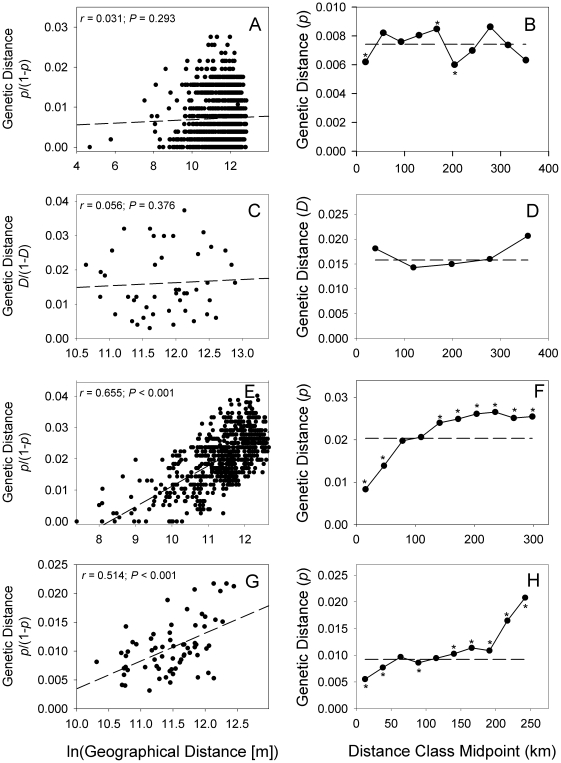
Figure 2. Results of Mantel tests (left column) and spatial autocorrelation analyses (right column) for four species investigated.
Panels A and B: S. o. caurina. Panels C and D: P. monticola, Panels E and F: R. variegatus, Panels G and H: A. longicaudus. Distance classes in spatial autocorrelations that showed significantly larger or smaller values at the α = 0.05 level than average (indicated by horizontal dashed lines) are marked with asterisks.

