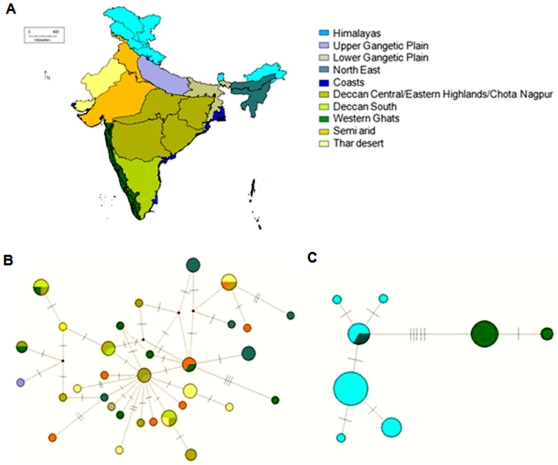
Figure 3. Haplotype networks.
3A Biogeographic regions of India corresponding to haplotypes. 3B. Median Joining haplotype network for 55 jungle cats (Felis chaus) with 460 bp NADH5 and 141 bp cytochrome b. 3C. Median Joining haplotype network for 40 leopard cats (Prionailurus bengalensis) with 362 bp NADH5, 202 bp cytochrome b. Bars on branches denote number of substitutions between connected haplotypes. Size of circle denotes number of individuals in the haplotype. Small circles are missing haplotypes.

