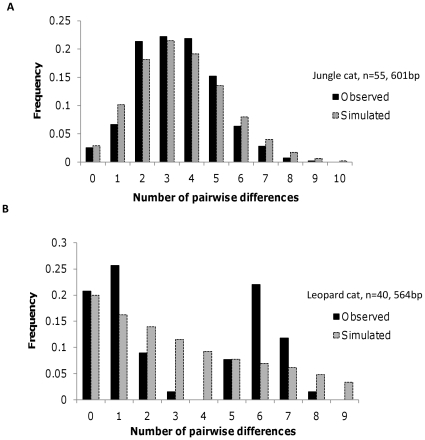
Figure 6. Mismatch distribution analysis of mitochondrial DNA.
6A. Jungle cat (Felis chaus) (n = 55 individuals, 601 bp consisting of 460 bp of NADH 5 and 141 bp of cytochrome b). 6B. Leopard cat. (Prionailurus bengalensis) (n = 40 individuals, 564 bp consisting of 362 bp of NADH 5 and 202 bp of cytochrome b).

