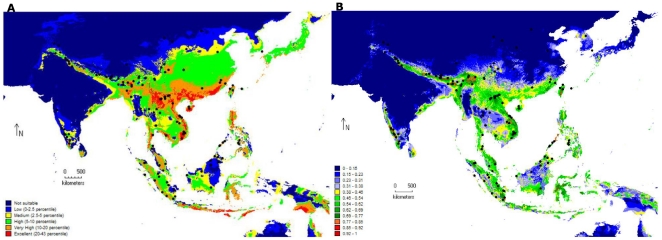
Figure 7. Niche model analysis with climatic data for leopard cats.
Niche model analysis for the global population of leopard cats (Prionailurus bengalensis), predicting suitable versus unsuitable habitats using BIOCLIM and MaxEnt algorithms. Analyses included 140 unique records of leopard cat locations (black dots) obtained from museum records, literature and current study and 8 variables of temperature (annual range, maximum summer, mean of the driest and coldest quarter) and precipitation (wettest month, seasonality, warmest and coldest quarter). Climatic data was obtained from the WORLDCLIM data set [42] for 2.5 min intervals. 7A. BIOCLIM model showing habitat suitability for leopard cats as a percentile of occurrences. Blue is unsuitable habitat, while red is excellent habitat. 7B. MaxEnt model showing habitat suitability for leopard cats as a probability of occurrence where blue indicates very low probabilities and red indicates high probability.

