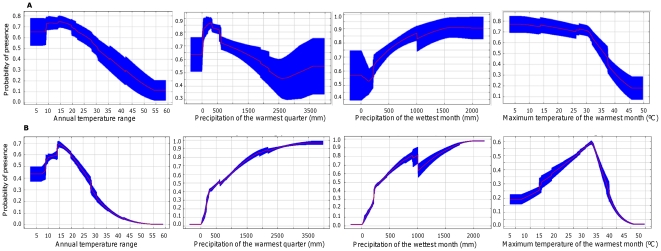
Figure 8. Response curves of MaxEnt models of habitat suitability for leopard cat (Prionailurus bengalensis) to predictor variables.
8A. Models constructed by altering each variable at a time while keeping all others at their average values. Response curves presented as means of 10 replicates with standard deviation in blue. 8B. Models constructed using only one variable at a time. Response curves presented as means of 10 replicates with standard deviation in blue.

