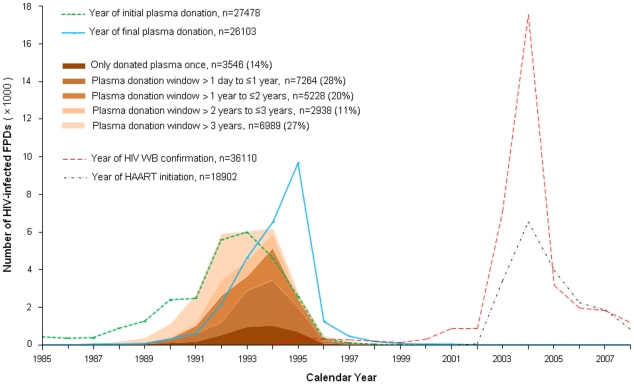
Figure 3. Distribution of the estimated time of HIV infection.
Distribution of the estimated time of HIV infection among the subset of former plasma donors (FPD; N = 25960) with known initial and final plasma donation dates, using the midpoint of the donation window as the date of infection and stratified by the duration of the plasma donation window, from those who only donated once (first and last donation dates the same) to those who donated for more than three years. Dates of Western blot (WB) confirmation of HIV infection and initiating highly active antiretroviral therapy (HAART) are also shown.

