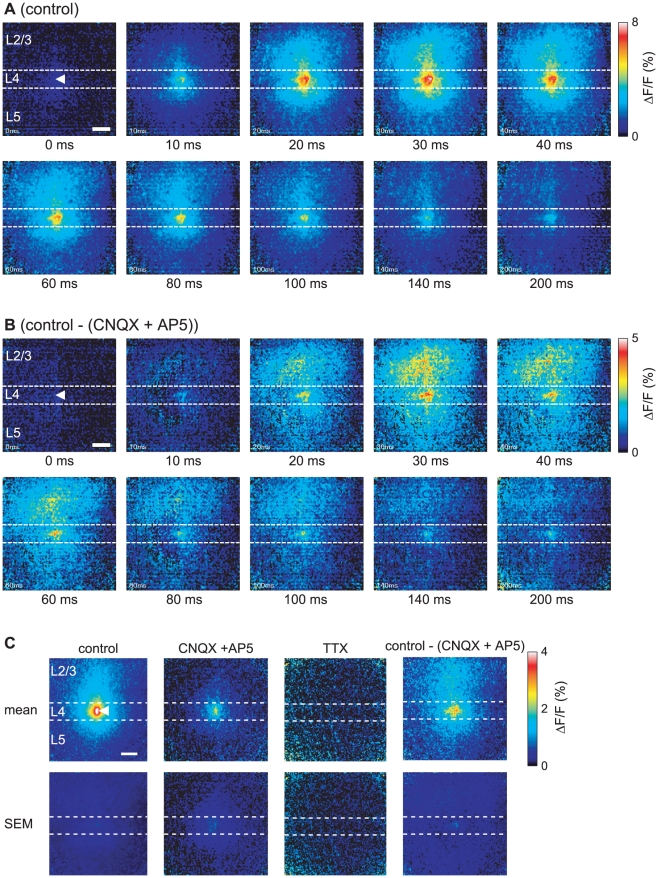
Figure 2. Spatiotemporal properties of signal propagation evoked by layer 4 stimulation.
Time-lapse pseudocolor images of the [Ca2+]i transients evoked by application of an 80 µA stimulus in layer 4 (white arrowhead) under the control condition (A) and of the orthodromic response obtained by subtraction of the ΔF/F values under the administration of CNQX and AP5 from those under the control condition (B). The time elapsed after stimulation is shown under each image. (C) Distributions of mean values (mean) and errors (SEM) of the peak amplitudes of the [Ca2+]i transients evoked by 80 µA layer 4 stimulation under the control condition (control, n = 9 slices), the administration of CNQX and AP5 (CNQX + AP5, n = 5 slices), and the administration of TTX (TTX, n = 4 slices), as well as of the mean and error values obtained by subtraction of the ΔF/F values under the administration of CNQX and AP5 from those under the control condition (control − (CNQX + AP5), n = 5 slices). Scale bar = 100 µm.

