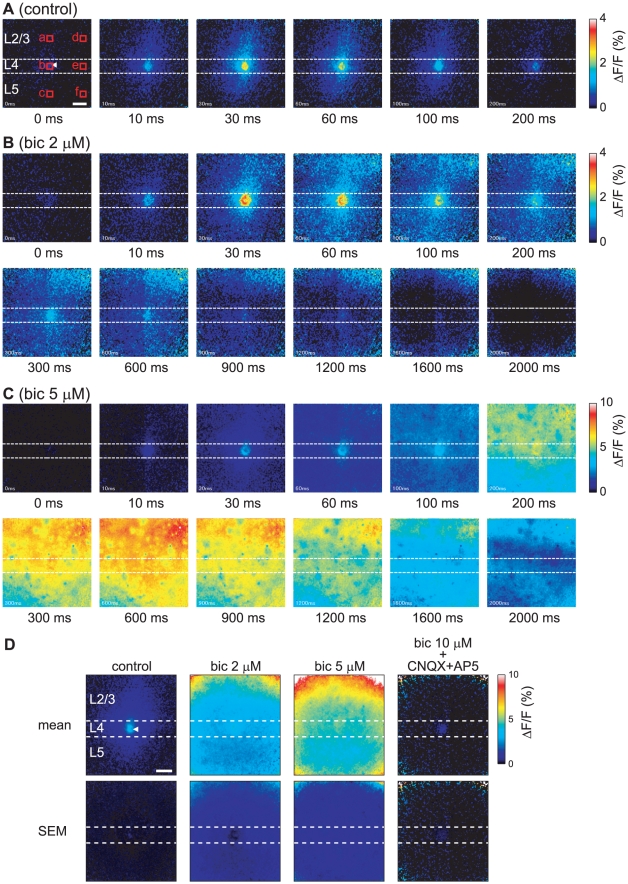
Figure 5. Blockade of inhibitory synaptic transmission enhanced the evoked signal propagation.
Time-lapse pseudocolor images of the [Ca2+]i transients evoked by the application of an 80 µA stimulus in layer 4 under the control condition (A), under the condition of 2 µM bicuculline administration (B), and under the condition of 5 µM bicuculline administration (C). The illustrations are the same as those in Figure 2. (D) Distributions of mean values (mean) and errors (SEM) of the peak amplitudes of the [Ca2+]i transients evoked by 80 µA layer 4 stimulation under the control condition, under the administration of 2 and 5 µM bicuculline (n = 4 slices), and under administration of 10 µM bicuculline with 10 µM CNQX and 50 µM AP5 (n = 3 slices) are shown. Scale bar = 100 µm.

