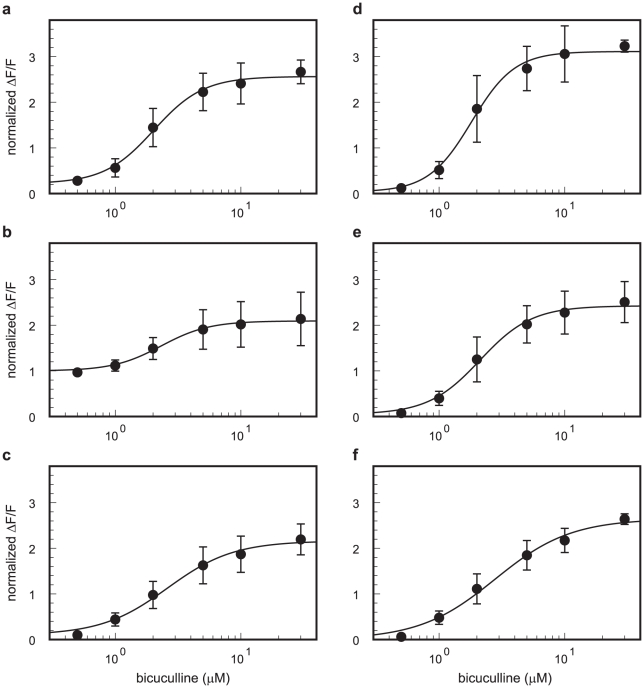
Figure 6. Effects of bicuculline application on the evoked [Ca2+]i transients.
Dose-response curves of the evoked [Ca2+]i transients to bicuculline administration in each of the regions. The normalized ΔF/F values (solid circle) were obtained from the maximum amplitudes of ΔF/F from the 16×16-pixel binned area indicated in the leftmost panel of Figure 5A (red square). The ΔF/F values were normalized by the amplitude in the stimulus position (region b) under the control condition. The values obtained from each slice were averaged (n = 4 slices). The stimulus intensity was 80 µA. The alphabetical index of each panel corresponds to the region indicated in leftmost panel of Figure 5A. The normalized ΔF/F values were fitted into the following equation (solid line): Base + Amax/(1+ (EC50/[bicuculline])nH). The fitted Amax, EC50, and nH values were as follows: region a, Amax = 2.4, EC50 = 2.0 µM, and nH = 2.2; region b, Amax = 1.1, EC50 = 2.3 µM, and nH = 2.3; region c, Amax = 2.1, EC50 = 2.6 µM, and nH = 1.6; region d, Amax = 3.1, EC50 = 1.8 µM, and nH = 2.5; region e, Amax = 2.4, EC50 = 2.1 µM, and nH = 2.1; and region f, Amax = 2.6, EC50 = 2.8 µM, and nH = 1.4. Error bars are represented as SEM.

