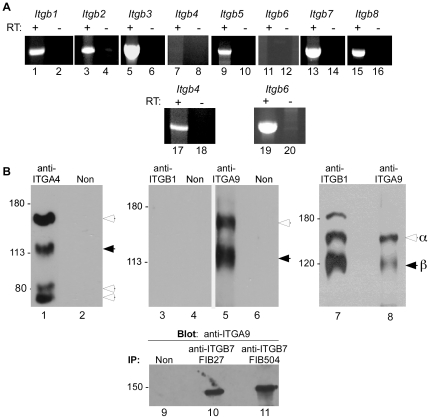
Figure 4. Integrin subunit expression in RPMI 8866 cells.
Panel A. RT-PCR analysis of ITGB subunit mRNA expression in RPMI 8866 cells (lanes 1–16) or control tissue (spleen, lanes 17–20). First strand cDNA was prepared from RNA with reverse transcriptase (+), or, as a negative control, without RT (−). This shows that RPMI 8866 cells express ITGB1, ITGB2, ITGB3, ITGB5, ITGB7, and ITGB8 mRNA. ITGB4 and ITGB6 were not detected in RPMI 8866 cells, but these PCR products could be amplified from spleen cDNA. Panel B. Lanes 1–6 show immunoprecipitations performed with lysates from surface-biotinylated RPMI 8866 cells, lanes 7–8 show immunoprecipitations performed with lysates from surface-biotinylated Tera-2 cells, and lanes 9–11 show immunoprecipitations performed with lysates from unlabeled RPMI 8866 cells; samples were run under non-reducing conditions. Immunoprecipitations were performed with anti-ITGA4 (lane 1; PS/2), anti-ITGB1 (lanes 3 and 7, ABII2), anti-ITGA9 (lanes 5 and 8, Y9A2), anti-ITGB7 (lane 10, FIB27; lane 11, FIB504) or appropriate species-matched nonimmune IgGs. Bands in blots with lanes 1–8 were detected with avidin, and the blot with lanes 9–11were probed by anti-ITGA9 immunoblotting. Open arrowheads indicate integrin α subunits, and solid arrowheads indicate integrin β subunits (Note: ITGA4 in Lane 1 is observed in intact and cleaved forms [45], [94].)

