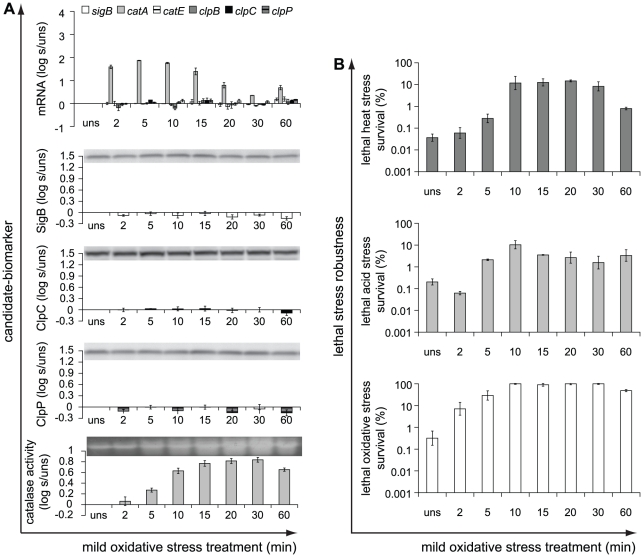
Figure 5. Induction of candidate-biomarkers and robustness in response to mild oxidative stress treatment.
a) Candidate-biomarkers − the transcripts of sigB, catA, catE, clpB, clpC and clpP, the proteins SigB, ClpC and ClpP, and catalase activity − were quantitatively measured in unstressed (uns) cultures (OD600 nm ∼0.4–0.5) and in the stressed cultures (s) after 0.1 mM H2O2 stress treatment for 2, 5, 10, 15, 20, 30 and 60 min. The columns mark the log10-fold induction after mild oxidative stress treatment compared to unstressed cells. b) Unstressed and 0.1 mM H2O2-treated cells were inactivated by exposure to 50°C for 5 min, pH 3.3 at 30°C for 3.5 min, and 0.2 mM H2O2 at 30°C for 2 min, to determine their robustness towards lethal heat, acid and oxidative stress, respectively. The columns mark the number of microorganisms surviving the lethal stress treatment compared to the initial number of microorganisms (%). Error bars represent standard errors of the reproductions.

