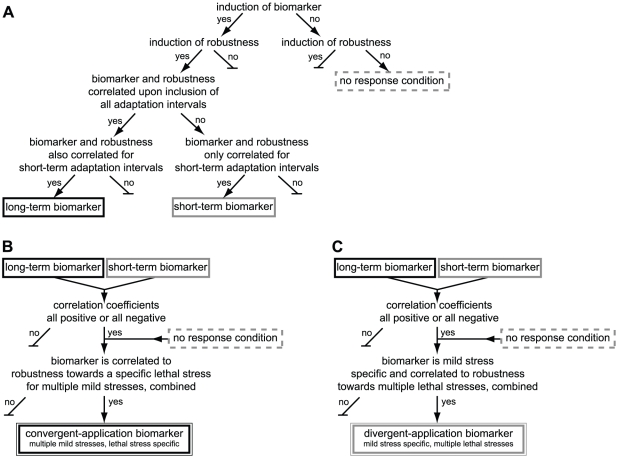
Figure 6. Framework for identification of biomarkers for mild stress induced enhanced robustness.
a) Decision flow chart for identification of long-term and short-term biomarkers for mild stress induced enhanced robustness. Black box represents a long-term biomarker and gray box represents a short-term biomarker. These biomarkers are mild stress and lethal stress specific. Dashed gray box represents a no response condition. b) Decision flow chart for identification of a convergent-application biomarker that is induced by multiple mild stress conditions and is correlated to a specific lethal stress robustness. c) Decision flow chart for identification of a divergent-application biomarker that is induced by a specific mild stress condition and is correlated to robustness towards multiple lethal stresses.

