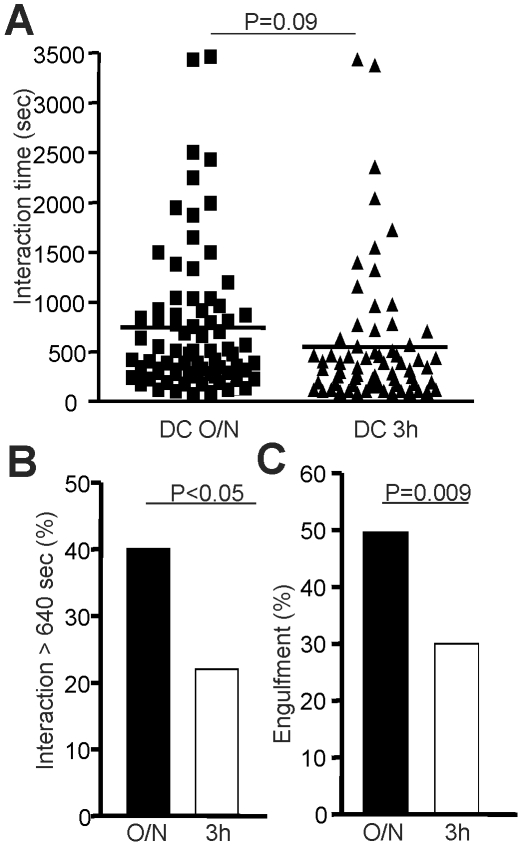
Figure 3. Epitope density dictates the duration and the quality of T-DC interaction.
A. The duration of contact between naïve CD8+ T cells and DC O/N or DC 3 h was measured in vitro using time-lapse microscopy. B. The percentage of naïve CD8+ T cells interacting for more then 640 seconds with DCs is shown for DC 3 h or DC O/N. C. The proportion of T-DC interaction that leads to engulfment of naïve CD8+ T cells by DCs is shown for DC O/N or DC 3 h. Statistical analysis was done using a Mann-Whitney test.

