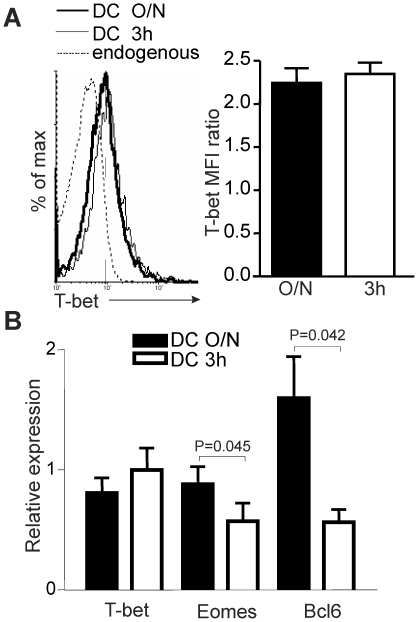
Figure 4. The amount of Ag encountered by naïve CD8+ T cells influences transcription factor expression.
A. No effect of Ag dose on T-bet expression. The left panel shows intracellular staining for T-bet in effectors at day 4 post-immunization with DC O/N or DC 3 h. The recipient endogenous population was used as a control. The right panel shows compilation of T-bet MFI. B. TCR engagement level finely tunes expression of key transcription factors. At d4 post-immunization, OVA-specific T cells (CD8+CD45.2+) were sorted from spleen and LNs to perform qPCR analysis. The relative expression of mRNA in effector CD8+ T cells obtained after immunization with DC O/N or DC 3 h is shown (normalized to HPRT). 3 independent experiments with 3 mice per group. Statistical analysis was done using a Mann-Whitney test.

