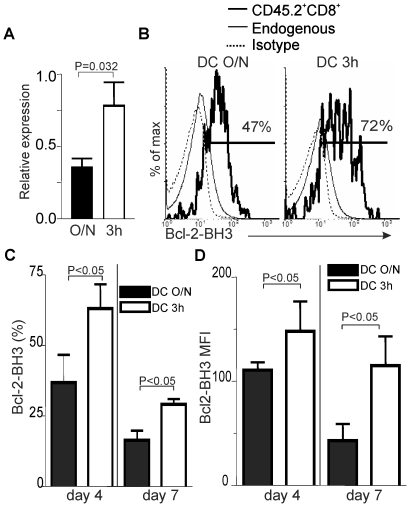
Figure 5. Selective downregulation of Nor-1 expression in effector CD8+ T cells generated with high Ag dose.
A. Expression of Nor-1 in effector CD8+ T cells. Effectors (CD8+CD45.2+) were sorted from spleen and LNs at d4 post-immunization to perform qPCR. The relative expression of Nor-1 after immunization with DC O/N or DC 3 h is shown (normalized to HPRT). 3 independent experiments with 3 mice per group. B. Epitope density influences the exposure of the BH3 domain of Bcl-2 in CD8+ effector T cells. The overlays show staining gated on OVA-specific effector (CD8+CD45.2+) T cells obtained at day 4 post-immunization with DC O/N or DC 3 h. The controls were isotype and staining of the endogenous population (CD8+CD45.2−). C and D. The histogram represents the percentage (C) and the MFI (D) of Bcl-2-BH3 expression by Ag-specific T cells at d4 or d7 post-immunization with DC O/N or DC 3 h. 3 independent experiments with 2–3 mice per group. Statistical analysis was done using a Mann-Whitney test for panel A and a Student's t test for panels C and D.

